HZAU-BioNLP Team
May, 2023
AD-LitPathoNet is an abbr. for “Alzheimer’s Disease – Pathology Network with Rich Literature Evidence“. AD-LitPathoNet enables quick and interactive search w.r.t gene or phenotype query. The search utility provides insight to novel association recommendation, interaction enrichment, and visualized evidence tracing, thus suggesting its heuristic application in AD mechanism investigation.
Visit us: http://lit-evi.hzau.edu.cn/AD-LitPathoNet/
Data Curation: The data resource of AD-LitPathonNet includes PubMed abstracts and PMC full texts related to AD. Upon the large-scale literature, we developed a corpus and BioNLP pipeline to extract gene, phenotype data, and their association descriptions. A pathology network is constructed, and rich literature evidence is provided accordingly.
Data Statistics: The background database in AD-LitPathoNet supporting the AD pathology description includes the following.
- # of PubMed Abstracts: 110,664
- # of PMC full texts: 49,269
- # of literature evidence (sentence-level): 864,855
- # of genes with reported mutations: 6,831
- # of GO terms: 1,678
- # of HPO terms: 3,737
- # of MeSH terms: 2,975
1. Knowledge Representation Paradigm of Pathology Mechanism for AD
A “Traceable pathology mechanism representation” is set up for the knowledge representation paradigm in support of AD pathology mechanism.
The biomarkers used for the pathology illustration include gene and mutation, while the phenotypes descriptors include GO, HPO and MeSh.
First, mutation, gene (or protein) and the “occurred_in” relation is mined from the texts. Subsequently, the downstream biological process, standardized by GO
terminology, is retrieved. Meanwhile, the “caused” relation between a mutation and a downstream biological process is recognized via intelligent NLP method. By doing so, the “traceable pathology mechanism representation” captures a clear pathology description that a mutation “occurred_in” a gene “caused” a downstream biological process. As well, this knowledge representation is traceable since the supportive literature evidence is stored simultaneously
In summary, the “traceability” of AD-LitPathoNet refers to two respective.
▩ First, the logic of biomarker and downstream phenotype is accurate and traceable. The causal relationship between biomarker and the downstream phenotype forms the basis for pathology mechanism illustration in the AD context.
▩ Second, the sentence-level literature evidence is traceable.
Based on large-scale text mining, knowledge curation, and evidence tracing, AD-LitPathoNet makes it possible to explore the AD pathology mechanism and trace the evidence systematically.
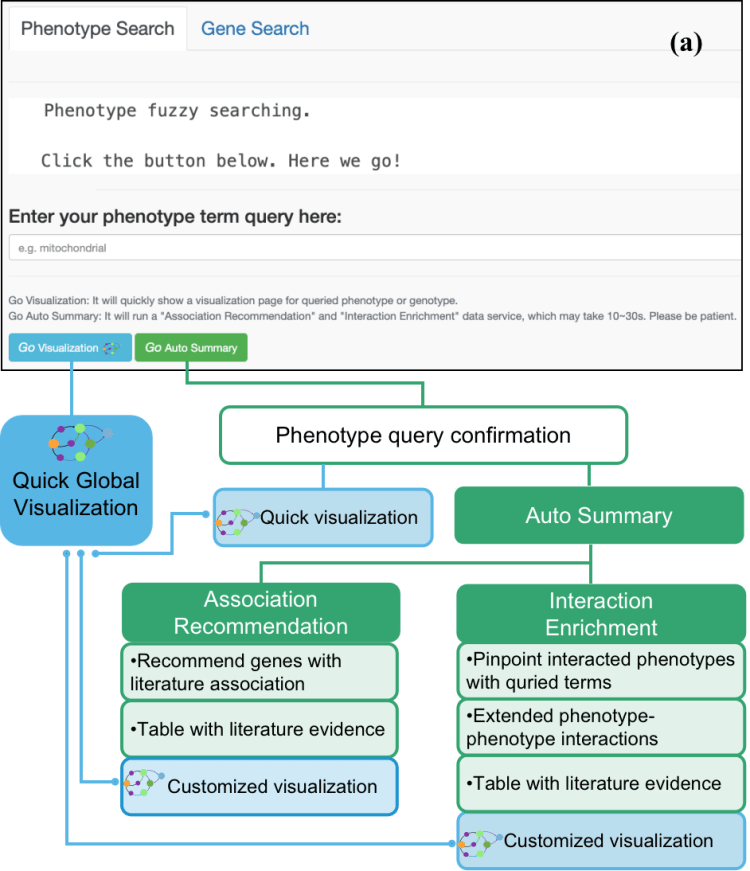
2. Data Service Modules in AD-LitPathoNet
AD-LitPathoNet provides three types of data service modules, i.e., Association Recommendation, Interaction Enrichment, and Query and Visualization of Literature Evidence.
▩ Association Recommendation for Phenotype or Gene query
Recommend associated phenotype (or gene) data for queried gene (or phenotype) data.
▩ Interaction Enrichment Based on Gene-Phenotype Association
For the queried gene (or phenotype) data, run the enrichment analysis, and extend the mechanism illustration to interacted gene (or phenotype) data.
▩ Literature Evidence Visualization.
A visualization page for each step of result is available.
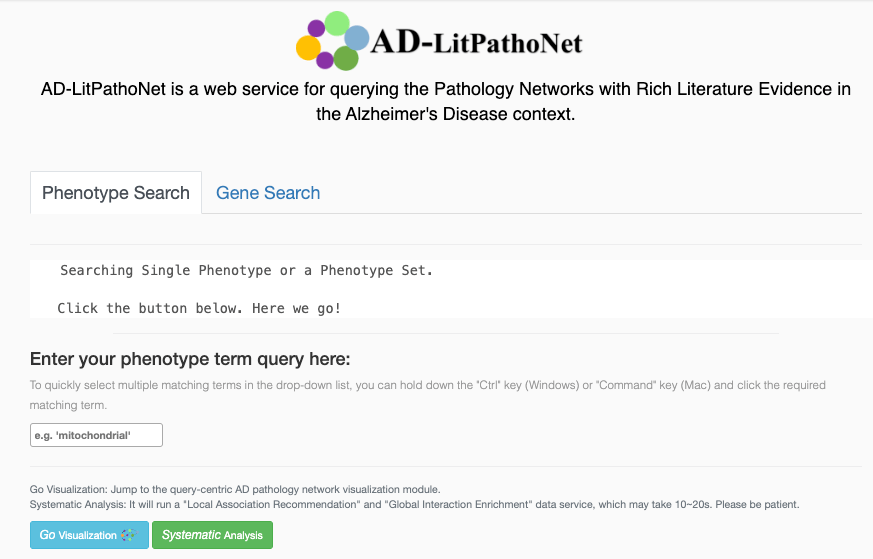
3. Query Types for AD-LitPathoNet
AD-LitPathoNet provides two types of data services for gene or phenotype queries.
▩ Query the phenotype
▩ Query the gene

4. Query Examples
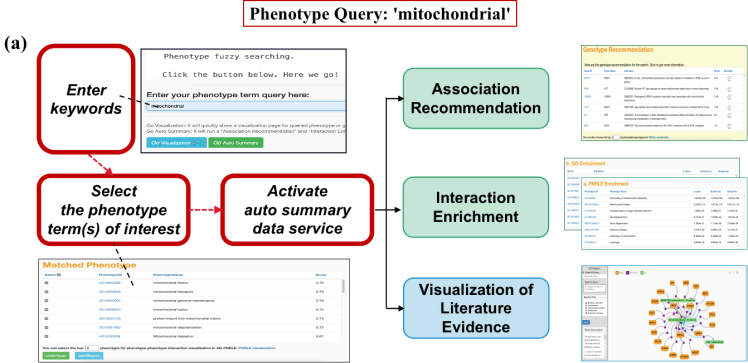
▩ Example A. Data service for a “mitochondria” phenotype query.
▩ General query process
- The user input the keyword “mitochondria”, and the back-end would list all the phenotype entries including the queried terms. (From GO/HPO/MeSH)
- The Association Recommendation module provides a ranked associated gene data to the queried phenotypes;
- The Interaction Enrichment module provides interacted phenotypes with “mitochondrial” phenotype data.
- The Literature Evidence Visualization module offers literature evidence checking.
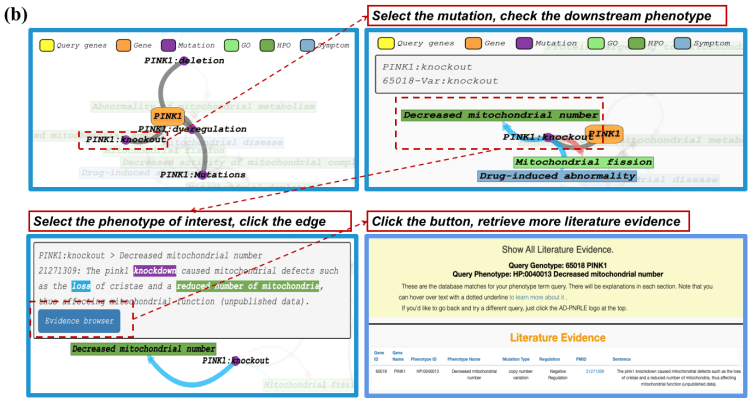
▩ Investigate the AD-pathology via the “Literature Evidence Visualization” service
- Hover the cursor to the targeted gene which is related to mitochondrial (take PINK1 as an example in the figure), and one can check the mutation with ‘Occur_in‘ relation with the gene. By filling the checkbox in the left side-box, various mutation types could be selected, e.g., rsID, modification, point mutation, and so on.
- Hover the cursor onto one of the mutation (take PINK1:knockout as an example in the figure), and one could check the highlighted downstream phenotypes.
- Click the edge between the mutation and the phenotype of one’s interest, and a pop-up window will show the corresponding literature evidence. The evidence showcasing is given in a rich annotation form where the mutation, gene and phenotype are all marked in color.
- Click the blue button, and retrieve all of the literature evidence, along with external PubMed links.
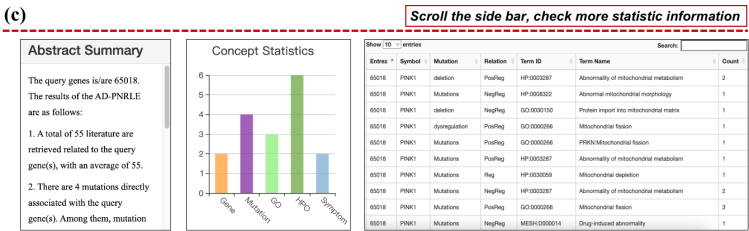
▩ Other reports and statistics provided in the “Literature Evidence Visualization” service
According to the queried terms, the “Literature Evidence Visualization” module provides the following:
- Data downloading for the queried result;
- Figure generation for the visualization page;
- Generation of abstract summary;
- Statistics of visualized results;
- Tables showcasing the literature entries.
ENJOY !
